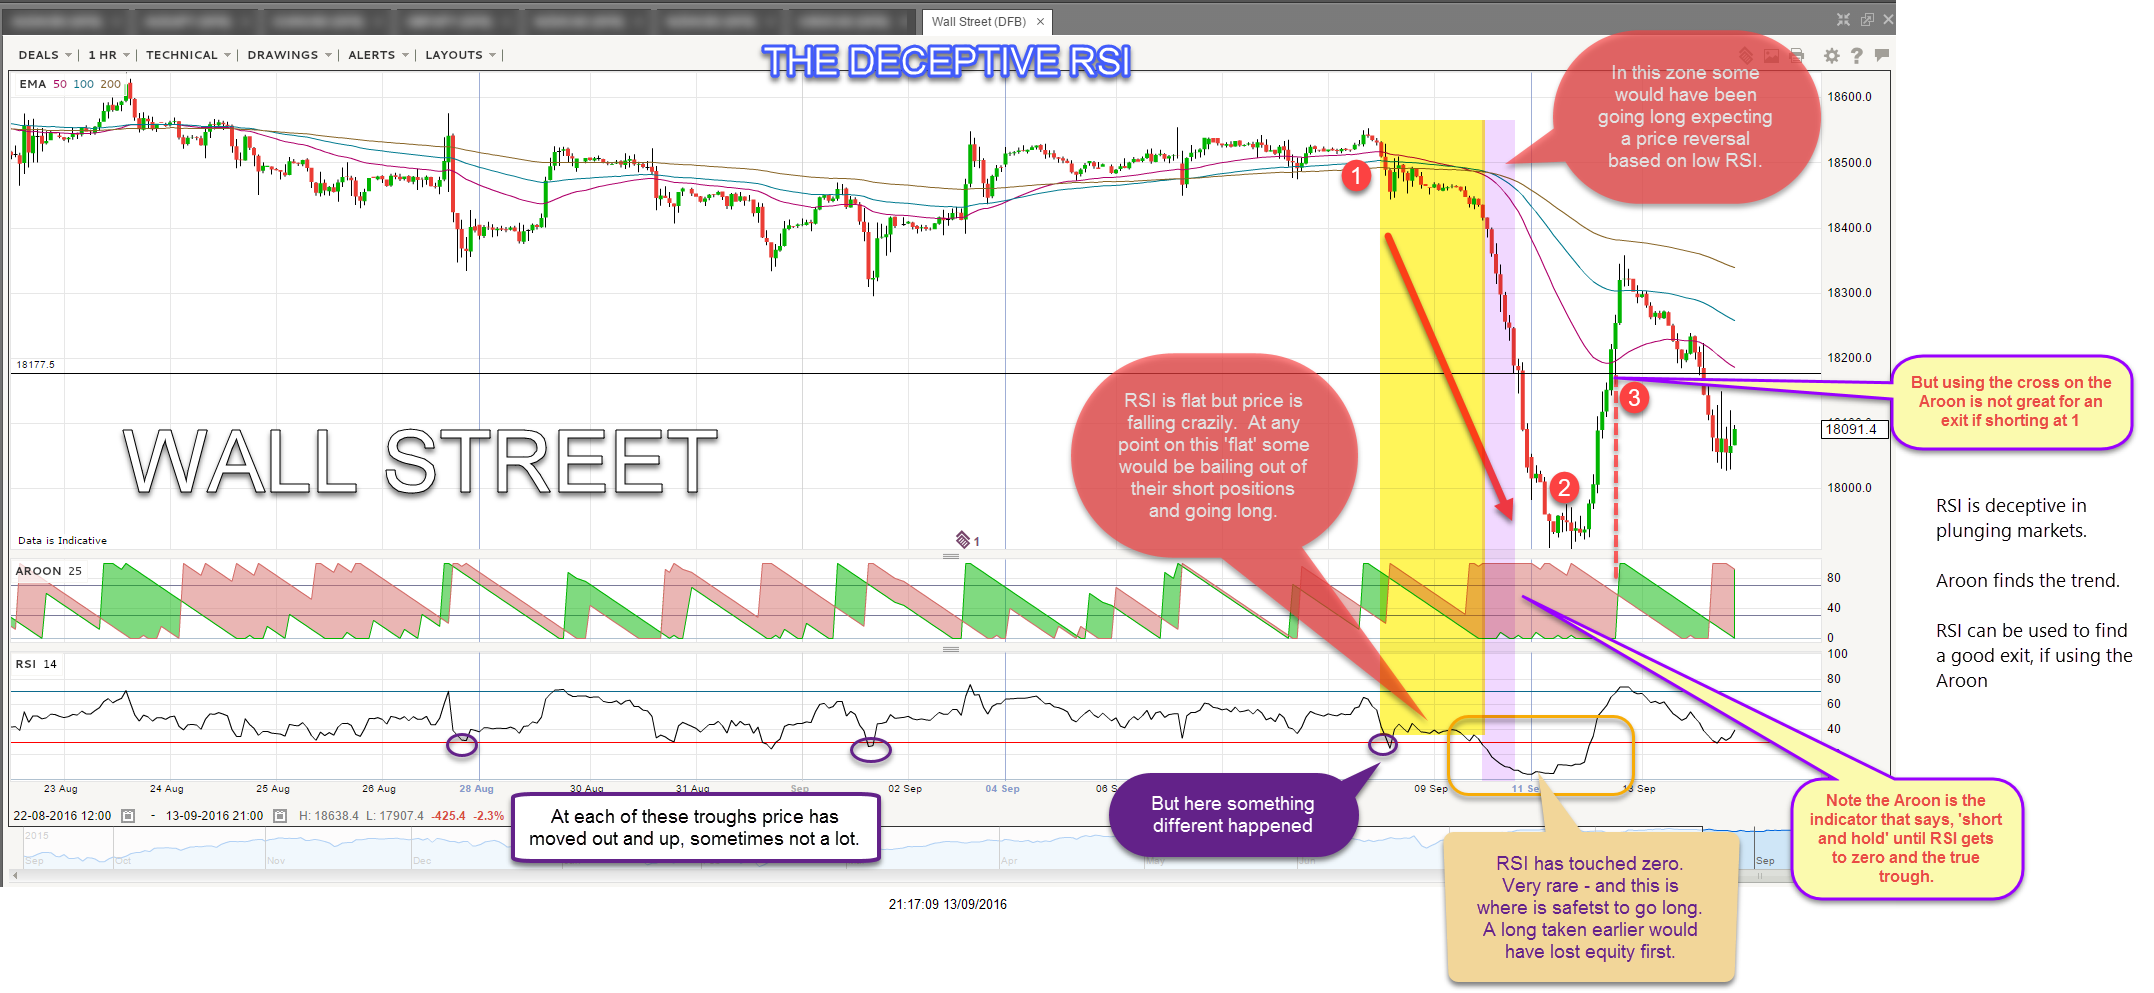
The RSI (relative strength index) is classified as a ‘leading indicator’ because it is thought to have predictive value. By contrast lagging indicators are said to simply follow price and have less predictive value e.g. bollinger bands.
The reality is that no indicator can predict anything and all indicators have limited predictive value because they all rely on historical price movements. Notions of predictive value are formed after events have happened, and are subject to a bias by what ‘has happened’ and what has followed.
RSI values will plummet as price plummets deeply. There is some divergence of RSI at times from price movement and some gurus hold that the divergence has predictive value – no the RSI itself. High RSIs (>75) and low RSIs (<25) give information about price-momentum. But RSI’s do some very strange things. I’ve seen it too many times. The chart below is illustrative.
In essence the RSI is powerful when we have price-momentum. The Aroon is powerful when we have time-momentum. Finding the right mix of the two concepts can maximise profits. No – we can’t tell you how to find the right mix – because there is no formula to work it out.

Leave a Reply
You must be logged in to post a comment.