
The following charts tell of a possible other way of increasing the probability of making winning trades. In essence it is about interpreting what’s happening to the price of stock as they approach quarterly earnings releases and reports.
Pictures below can be clicked for a larger view (and you may need to zoom in (and out) with your browser: CTRL and + or CTRL and – on keyboard).
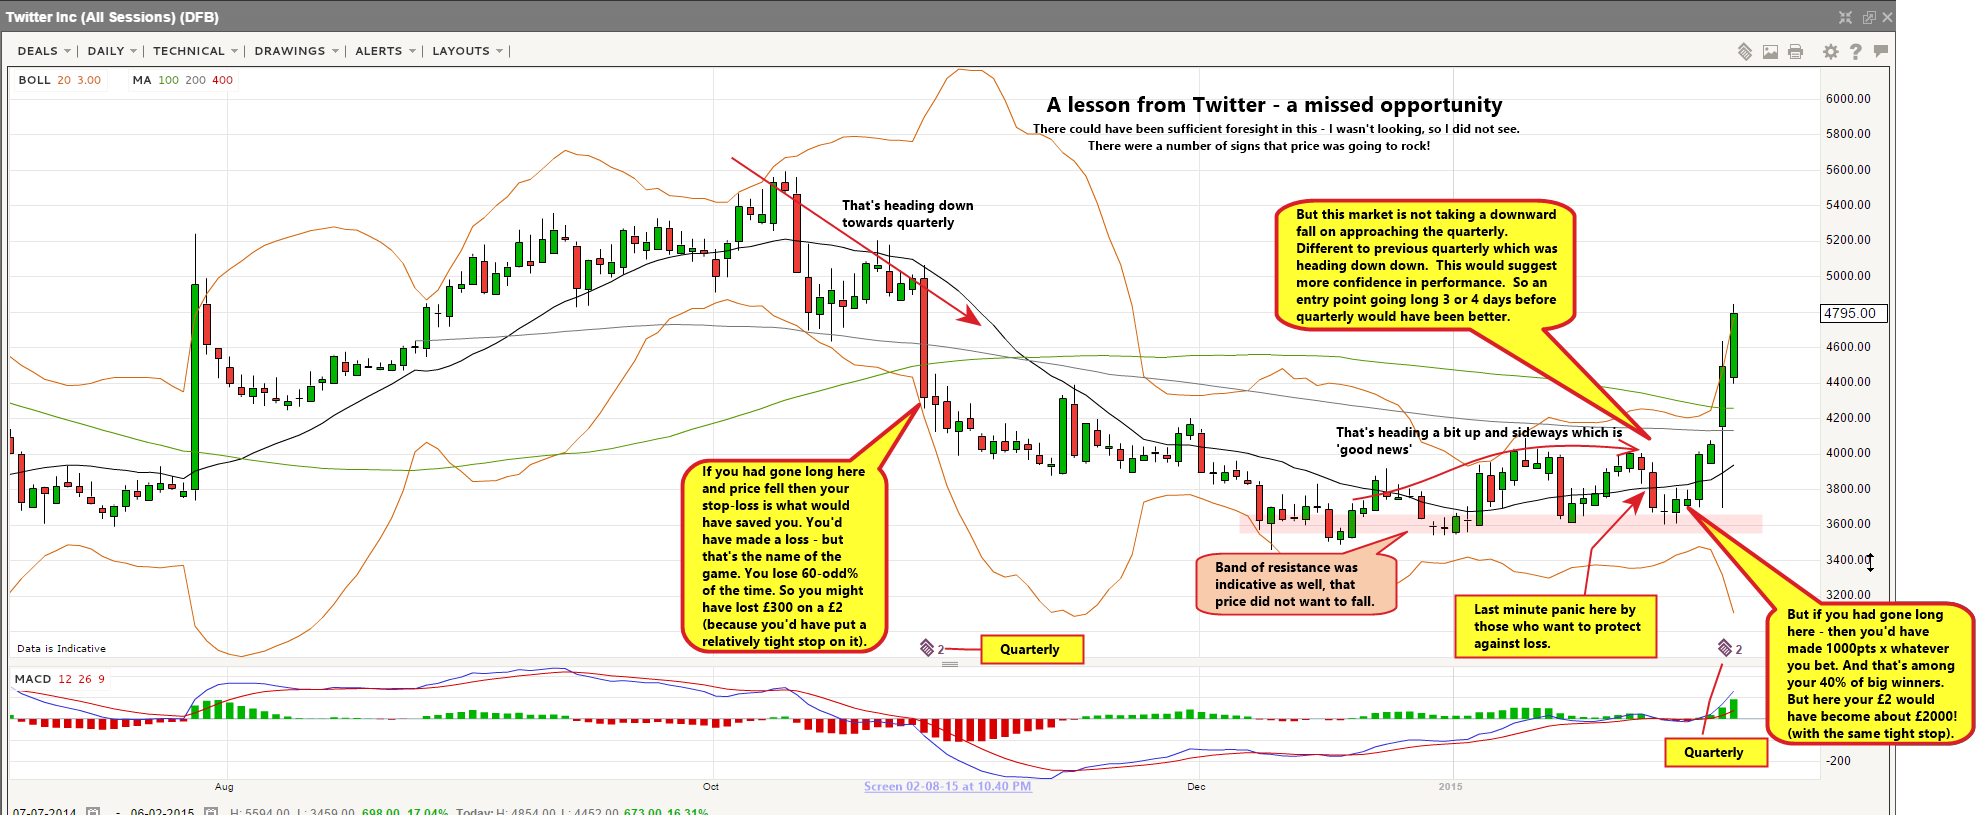
Missing the Twitter opportunity was a painful one. The above analysis was carried out retrospectively, to see what I missed. I just was not looking. That’s the first big mistake. But where do you look for Earnings Reports? That’ll come at the end of this post. For the while focus on what’s happening in these charts.
I also missed Pfizer, because I wasn’t watching. Well that had to stop – and quickly!

But I began to watch!! The following charts are only indicative. I do not post all that I’ve been successful with using this method.

The results so far speak for themselves. As always – this way of trading carries no guarantees. This is not a recommendation to adopt, or to change your preferred strategy. But there is a golden rule in trading, ‘Run with what works for you’.
Much of this is about money management, risk management, knowing how and when to trade and setting stop-loses. Successful trading results from a number of factors. Interpreting price action and understanding company reports. Some may see this as the big words, ‘Fundamental Analysis’. I don’t understand the main aspects of all that. I’m looking mainly at the market psychology, that’s played out in the charts.

Does 99,600% gain interest anybody? This on Disney below, is not to convince anybody. I have no business convincing anybody of anything. If you can take it and work it.. then do so. If you bust – sue yourself.

Earnings Reports Calendar are at NASDAQ: http://www.nasdaq.com/earnings/earnings-calendar.aspx